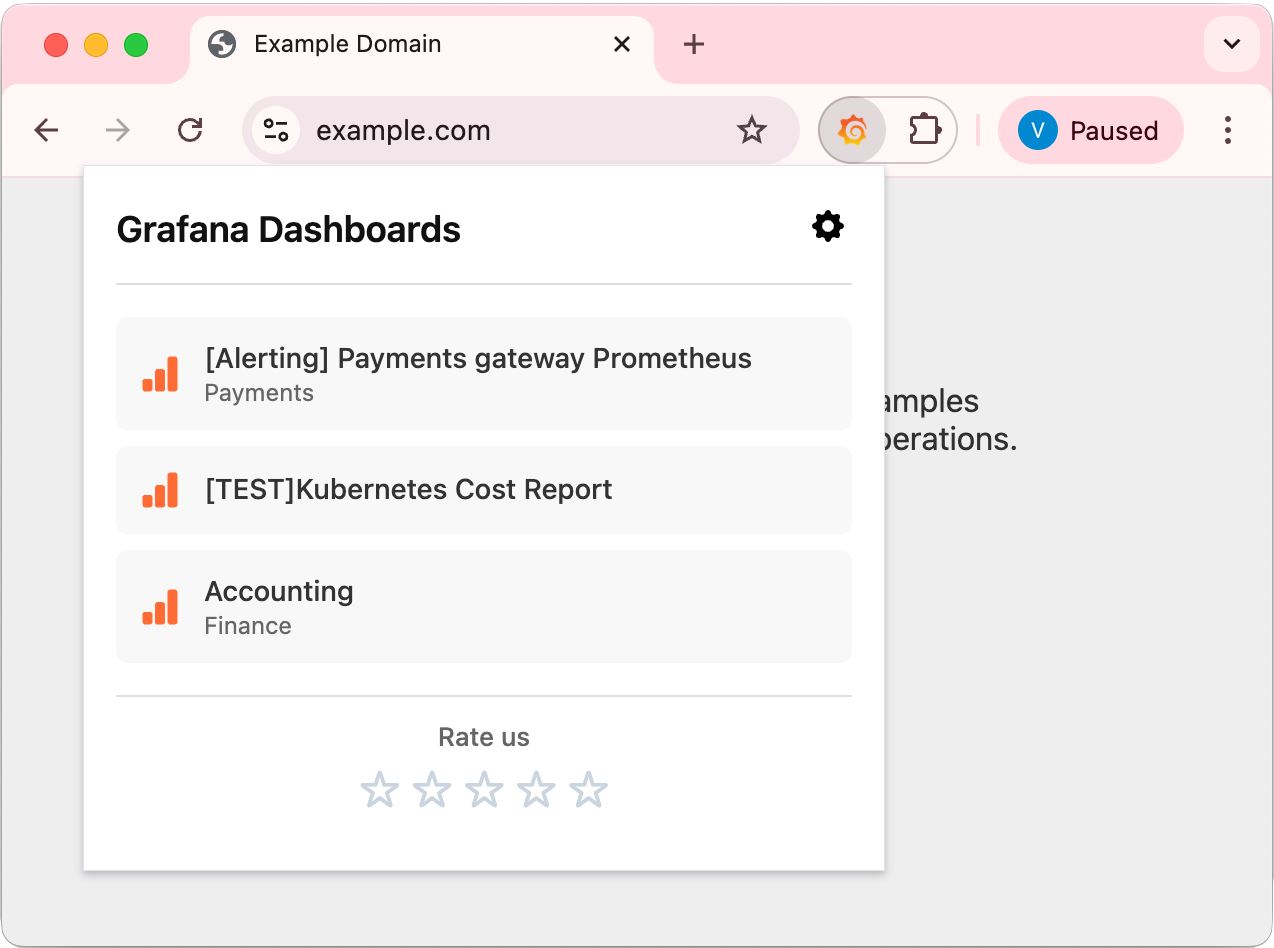
Jump to Grafana dashboards in one click
Connect multiple Grafana instances, select dashboards for each domain, and access them instantly from the extension popup.
Built for speed
Stop wasting time searching for dashboards. Get to your metrics instantly.
Multiple Instances
Connect multiple Grafana servers. Organize dashboards across different environments.
Dashboard Picker
Browse and select dashboards directly from your Grafana via API. No manual URL copying.
Domain Mapping
Assign dashboards to domains. When you visit a site, relevant dashboards appear automatically.
One-Click Access
Click any dashboard in the popup to open it instantly. No more bookmark hunting.
Perfect for...
Whether you're debugging production or reviewing performance, Grafana Dashboards gets you there faster.
Incident Response
Site down? One click from the failing page to its metrics. Save precious minutes during outages.
Multiple Environments
Connect staging, production, and dev Grafana instances. Switch dashboards per environment.
Team Workflows
Each team member configures their own dashboard shortcuts for the domains they work with.
Multi-Project Setup
Working on multiple projects? Map different dashboards to each project's domain.
Up and running in 60 seconds
Install
Add the extension from Chrome Web Store.
Connect
Add your Grafana instance and configure dashboards for your domains.
Access
Click the extension icon to instantly open your dashboards.
Stop searching. Start debugging.
Join engineers who access their Grafana dashboards in one click.
Add to Chrome - It's FreeGrafana Dashboards is an independent browser extension and is not affiliated with, endorsed by, or sponsored by Grafana Labs. Grafana is a trademark of Grafana Labs.